
Lesson 8: Workload Controllers - Deployments at Scale
What We’re Building Today
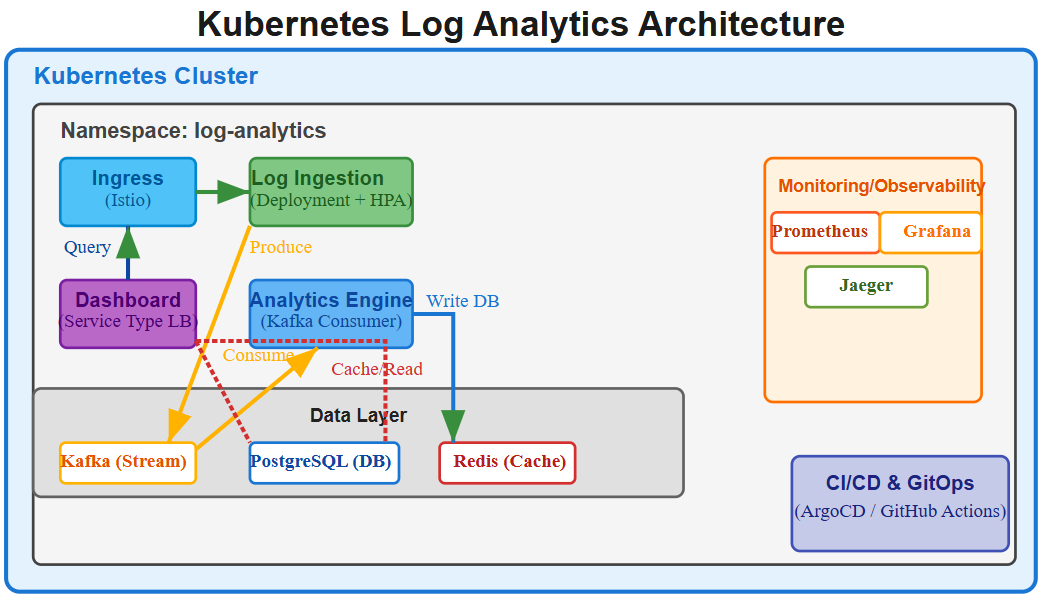
Today you’ll deploy a production-grade log analytics platform demonstrating Kubernetes Deployment patterns that power stateless applications at scale:
Multi-tier microservices architecture with log ingestion API, analytics engine, and real-time dashboard
Zero-downtime rolling updates with 99.99% availability using progressive rollout strategies
Horizontal Pod Autoscaling (HPA) responding to real traffic patterns with CPU and custom metrics
Complete observability stack tracking deployment health, rollout progress, and application performance
Why This Matters: The Deployment Controller’s Hidden Power
Spotify processes 4 million events per second across 180+ microservices. Netflix deploys 4,000+ times daily with zero user impact. These aren’t accidents—they’re the result of understanding Kubernetes Deployments as more than YAML templates.
When developers discuss “Kubernetes,” they often mean the Deployment controller—the orchestrator managing 80% of stateless workloads in production. Unlike bare Pods (which die and never return), Deployments provide the self-healing, rolling update, and declarative scaling primitives that make cloud-native operations possible.
The critical insight: Deployments don’t just manage Pods; they manage change itself. By creating ReplicaSets as immutable snapshots of desired state, Deployments enable progressive rollouts, instant rollbacks, and the pause/resume capabilities that separate production systems from prototypes. Understanding this three-layer hierarchy (Deployment → ReplicaSet → Pod) explains why Kubernetes can perform zero-downtime updates while AWS AutoScaling groups require complex launch configuration gymnastics.
Github Link:
https://github.com/sysdr/k8s_course/tree/main/lesson8/k8s-log-analyticsKubernetes Deployment Architecture: Beyond Basic Replication
The Three-Layer Orchestration Model
Kubernetes Deployments operate through a sophisticated control loop hierarchy rarely explained in tutorials:
Deployment Controller
  ├─ Manages ReplicaSet lifecycle and version history
  ├─ Implements rolling update strategy (MaxSurge/MaxUnavailable)
  └─ Provides rollback to any previous ReplicaSet
     │
     ├─ ReplicaSet Controller (Current Version)
     │   ├─ Ensures exactly N replicas are running
     │   ├─ Creates Pods from immutable template spec
     │   └─ Performs reconciliation every 10s
     │
     └─ ReplicaSet Controller (Previous Versions)
         └─ Kept for instant rollback (configurable history limit)
Why three layers? This enables Deployments to create new ReplicaSets during updates while gradually scaling down old ones—the mechanism behind rolling updates. When you execute kubectl set image, the Deployment controller creates a new ReplicaSet with updated Pod specs, then orchestrates the transition based on your maxSurge and maxUnavailable parameters.
The trade-off Netflix discovered: Keeping 10 ReplicaSet revisions (default) consumes minimal etcd space but enables instant rollback. However, in multi-tenant clusters with 1000+ Deployments, this history multiplies fast. Their solution: 3 revisions for most services, 10 for critical payment/streaming infrastructure.
Rolling Update Strategies: The Mathematics of Zero-Downtime
The maxSurge and maxUnavailable parameters define your deployment velocity vs. resource efficiency trade-off:
maxSurge: 25%, maxUnavailable: 25% (Default): Balanced approach. For 10 replicas, creates 3 new Pods before terminating 2 old ones.
maxSurge: 100%, maxUnavailable: 0% (Blue-Green pattern): Doubles resource usage temporarily but guarantees zero capacity reduction. Used by Airbnb for user-facing APIs.
maxSurge: 0%, maxUnavailable: 1 (Gradual rollout): Minimizes resource overhead. One Pod at a time. Spotify uses this for non-critical batch processors.
The counter-intuitive insight: Setting maxUnavailable: 0 doesn’t guarantee zero impact—it guarantees zero capacity loss. If your new version crashes on startup (failing readiness probes), Kubernetes won’t terminate old Pods, maintaining full capacity. This is why readiness probes aren’t optional in production.
Health Checks: The Real Orchestration Decision Point
Kubernetes makes Pod lifecycle decisions based on two distinct probe types:
Liveness Probe: Answers “Is this container broken beyond repair?” Failed checks trigger Pod restart. Use for detecting deadlocks, memory corruption, or unrecoverable state. Airbnb’s threshold: 3 consecutive failures over 30s before restart.
Readiness Probe: Answers “Can this Pod accept traffic right now?” Failed checks remove Pod from Service endpoints without restarting. Critical for rolling updates—new Pods must pass readiness before old Pods terminate.
The anti-pattern killing deployments: Using the same endpoint for both probes. Liveness should check internal health (/healthz), while readiness should verify external dependencies (/ready checking database connectivity). When a database hiccup fails liveness probes, Kubernetes restart-loops all Pods simultaneously—the “thundering herd” that took down a major fintech platform in 2023.
Implementation Walkthrough: Production Log Analytics System
Our implementation demonstrates Deployment patterns through a three-tier architecture:
Log Ingestion API (FastAPI): Receives logs via HTTP POST, validates schema, publishes to Kafka
Analytics Engine (Python): Consumes Kafka messages, performs aggregations, stores results in TimescaleDB
Dashboard Frontend (React): Real-time visualization of log metrics with WebSocket updates
Deployment Configuration Decisions
Resource Requests vs. Limits: We set requests at p50 resource usage and limits at p95. This ensures Kubernetes scheduling accounts for typical load while preventing memory leaks from affecting neighbors. The 50th percentile prevents over-provisioning; the 95th percentile prevents OutOfMemory kills during traffic spikes.
resources:
  requests:
    memory: “256Mi”    # Typical usage from load testing
    cpu: “200m”        # Average CPU during p95 traffic
  limits:
    memory: “512Mi”    # Maximum before Go garbage collector pressure
    cpu: “1000m”       # Burst capacity for request spikes
Replica Count Strategy: We start with 3 replicas (minimum for HA across availability zones) and configure HPA to scale up to 10 based on CPU and custom metrics (requests per second). The magic number “3” provides N+1 redundancy—one replica can fail, and you still have capacity during the replacement Pod’s startup time.
Rolling Update Configuration:
strategy:
  rollingUpdate:
    maxSurge: 1          # Create 1 extra Pod during rollout
    maxUnavailable: 0    # Never reduce capacity below desired replicas
  type: RollingUpdate
This ensures our 3-replica service maintains full capacity throughout updates. With maxSurge: 1, Kubernetes creates a 4th Pod (new version), waits for readiness, then terminates one old Pod. This continues until all replicas run the new version.
Progressive Rollout Implementation
The critical innovation in our deployment script: automated progressive rollouts with automatic rollback on error rate increase.
# Deploy new version with 1 replica canary
kubectl set image deployment/log-ingestion log-ingestion=v2
kubectl scale deployment/log-ingestion --replicas=1

# Monitor error rate for 5 minutes
ERROR_RATE=$(curl -s prometheus:9090/api/v1/query?query=error_rate | jq .data)

if [ “$ERROR_RATE” -gt 1% ]; then
  kubectl rollout undo deployment/log-ingestion
else
  kubectl scale deployment/log-ingestion --replicas=3  # Full rollout
fi
This pattern mirrors Spotify’s “confidence-based rollouts”—starting with 1% traffic, monitoring key metrics, then exponentially increasing to 100% only if health checks pass.
Production Considerations: When Deployments Fail
Scenario 1: Failed Rolling Update (Stuck Deployment)
Symptom: kubectl rollout status hangs indefinitely. Some Pods run old version, some new.
Root cause: New version fails readiness probes. Kubernetes creates new Pods but won’t terminate old ones because new Pods never become “ready.”
Solution: Investigate Pod logs (kubectl logs -f pod-name), check readiness probe endpoint, and if necessary, rollback: kubectl rollout undo deployment/log-ingestion. The Deployment controller instantly recreates the previous ReplicaSet.
Scenario 2: Cascading Failure During Update
Symptom: All Pods crash-loop during rolling update. Service becomes completely unavailable.
Root cause: minReadySeconds not configured. Kubernetes marks Pods “ready” immediately after readiness probe passes, before the application handles real traffic. Under load, Pods crash, triggering rapid replacement.
Solution: Set minReadySeconds: 30 to require 30 seconds of sustained readiness before considering Pod stable. This prevents rapid rollout of broken versions.
Scenario 3: Resource Exhaustion During Surge
Symptom: New Pods stuck in “Pending” during rolling update. Cluster has insufficient capacity.
Root cause: maxSurge creates temporary resource demand exceeding cluster capacity.
Solution: Either reduce maxSurge (slower rollouts but less resource pressure) or configure Cluster Autoscaler to provision nodes proactively. Netflix uses predictive autoscaling—analyzing historical deployment patterns to pre-scale capacity 5 minutes before scheduled rollouts.
Working Code Demo:
Scale Connection: Deployments in FAANG Production
Netflix’s Deployment Velocity: 4,000 deployments per day across 1,000+ microservices. Key pattern: Deployment-per-region strategy with progressive rollout (1% → 10% → 50% → 100% over 2 hours). Automatic rollback if error rate exceeds baseline by 1.5x.
Spotify’s Canary Analysis: Uses Flagger (automated progressive delivery) to deploy 180+ services hourly. Key insight: Deployment speed matters less than deployment safety. Their SRE team optimized rollback time from 15 minutes to 30 seconds—this reduced incident duration by 80%.
Airbnb’s Blue-Green Pattern: Runs two full production environments (blue/green). Deploys to inactive environment, runs integration tests, then switches traffic using Istio VirtualService. If issues detected within 1 hour, instant rollback via traffic switch (no Pod restarts needed).
The universal pattern: Deployments are your change management primitive. The companies mastering cloud-native operations treat Deployment configuration as seriously as application code—version controlled, tested in staging, and monitored in production.
Next Steps: Services & Network Exposure
Tomorrow we’ll explore Kubernetes Services—the networking abstraction that enables Deployments to communicate reliably despite constant Pod replacement. You’ll learn ClusterIP for internal communication, LoadBalancer for external traffic, and the DNS-based service discovery that makes microservices architectures possible without hard-coded IP addresses.
The key question we’ll answer: How does Netflix route 200 billion requests daily across constantly changing Pod IP addresses? The answer lies in understanding Services as load balancing abstractions with connection draining and session affinity patterns that enable zero-downtime updates at unprecedented scale.