
Lesson 70: Break-It-Friday — Debugging Kubernetes Scheduling and Networking
What We’re Building Today
Today’s lesson is deliberately different. Instead of shipping new features, we are going to break a working system and fix it under realistic production conditions — the way an on-call engineer actually experiences Kubernetes. By the end of this lesson you will have:
A fully deployed log-processing microservices platform (FastAPI ingestion service, Redis cache, Kafka pipeline, React analytics dashboard) with a deliberately broken Service-to-Pod wiring
A repeatable debugging workflow for the single most common Kubernetes networking failure: a Service with zero Endpoints
Instrumented Prometheus/Grafana dashboards that would have caught the outage before a human did
A documented incident postmortem template you can reuse for every scheduling or networking failure your cluster throws at you
Why This Matters
Every senior Kubernetes engineer I have worked with — at streaming companies pushing 10M+ concurrent connections, at fintechs running strict SLAs — has the same scar tissue: the “Service has no Endpoints” incident. It is quiet.
kubectl get podsshows everything Running.kubectl get svcshows the Service exists. Yet requests time out or return 503s from the Ingress. The gap between “the Pods are healthy” and “the Service can reach them” is where label selectors, readiness probes, and EndpointSlices live — and it is the single highest-frequency root cause of “mystery” outages in multi-team clusters. Teams that internalize this failure mode stop treating networking as a black box and start treating it as a deterministic, inspectable graph.
Kubernetes Architecture Deep Dive
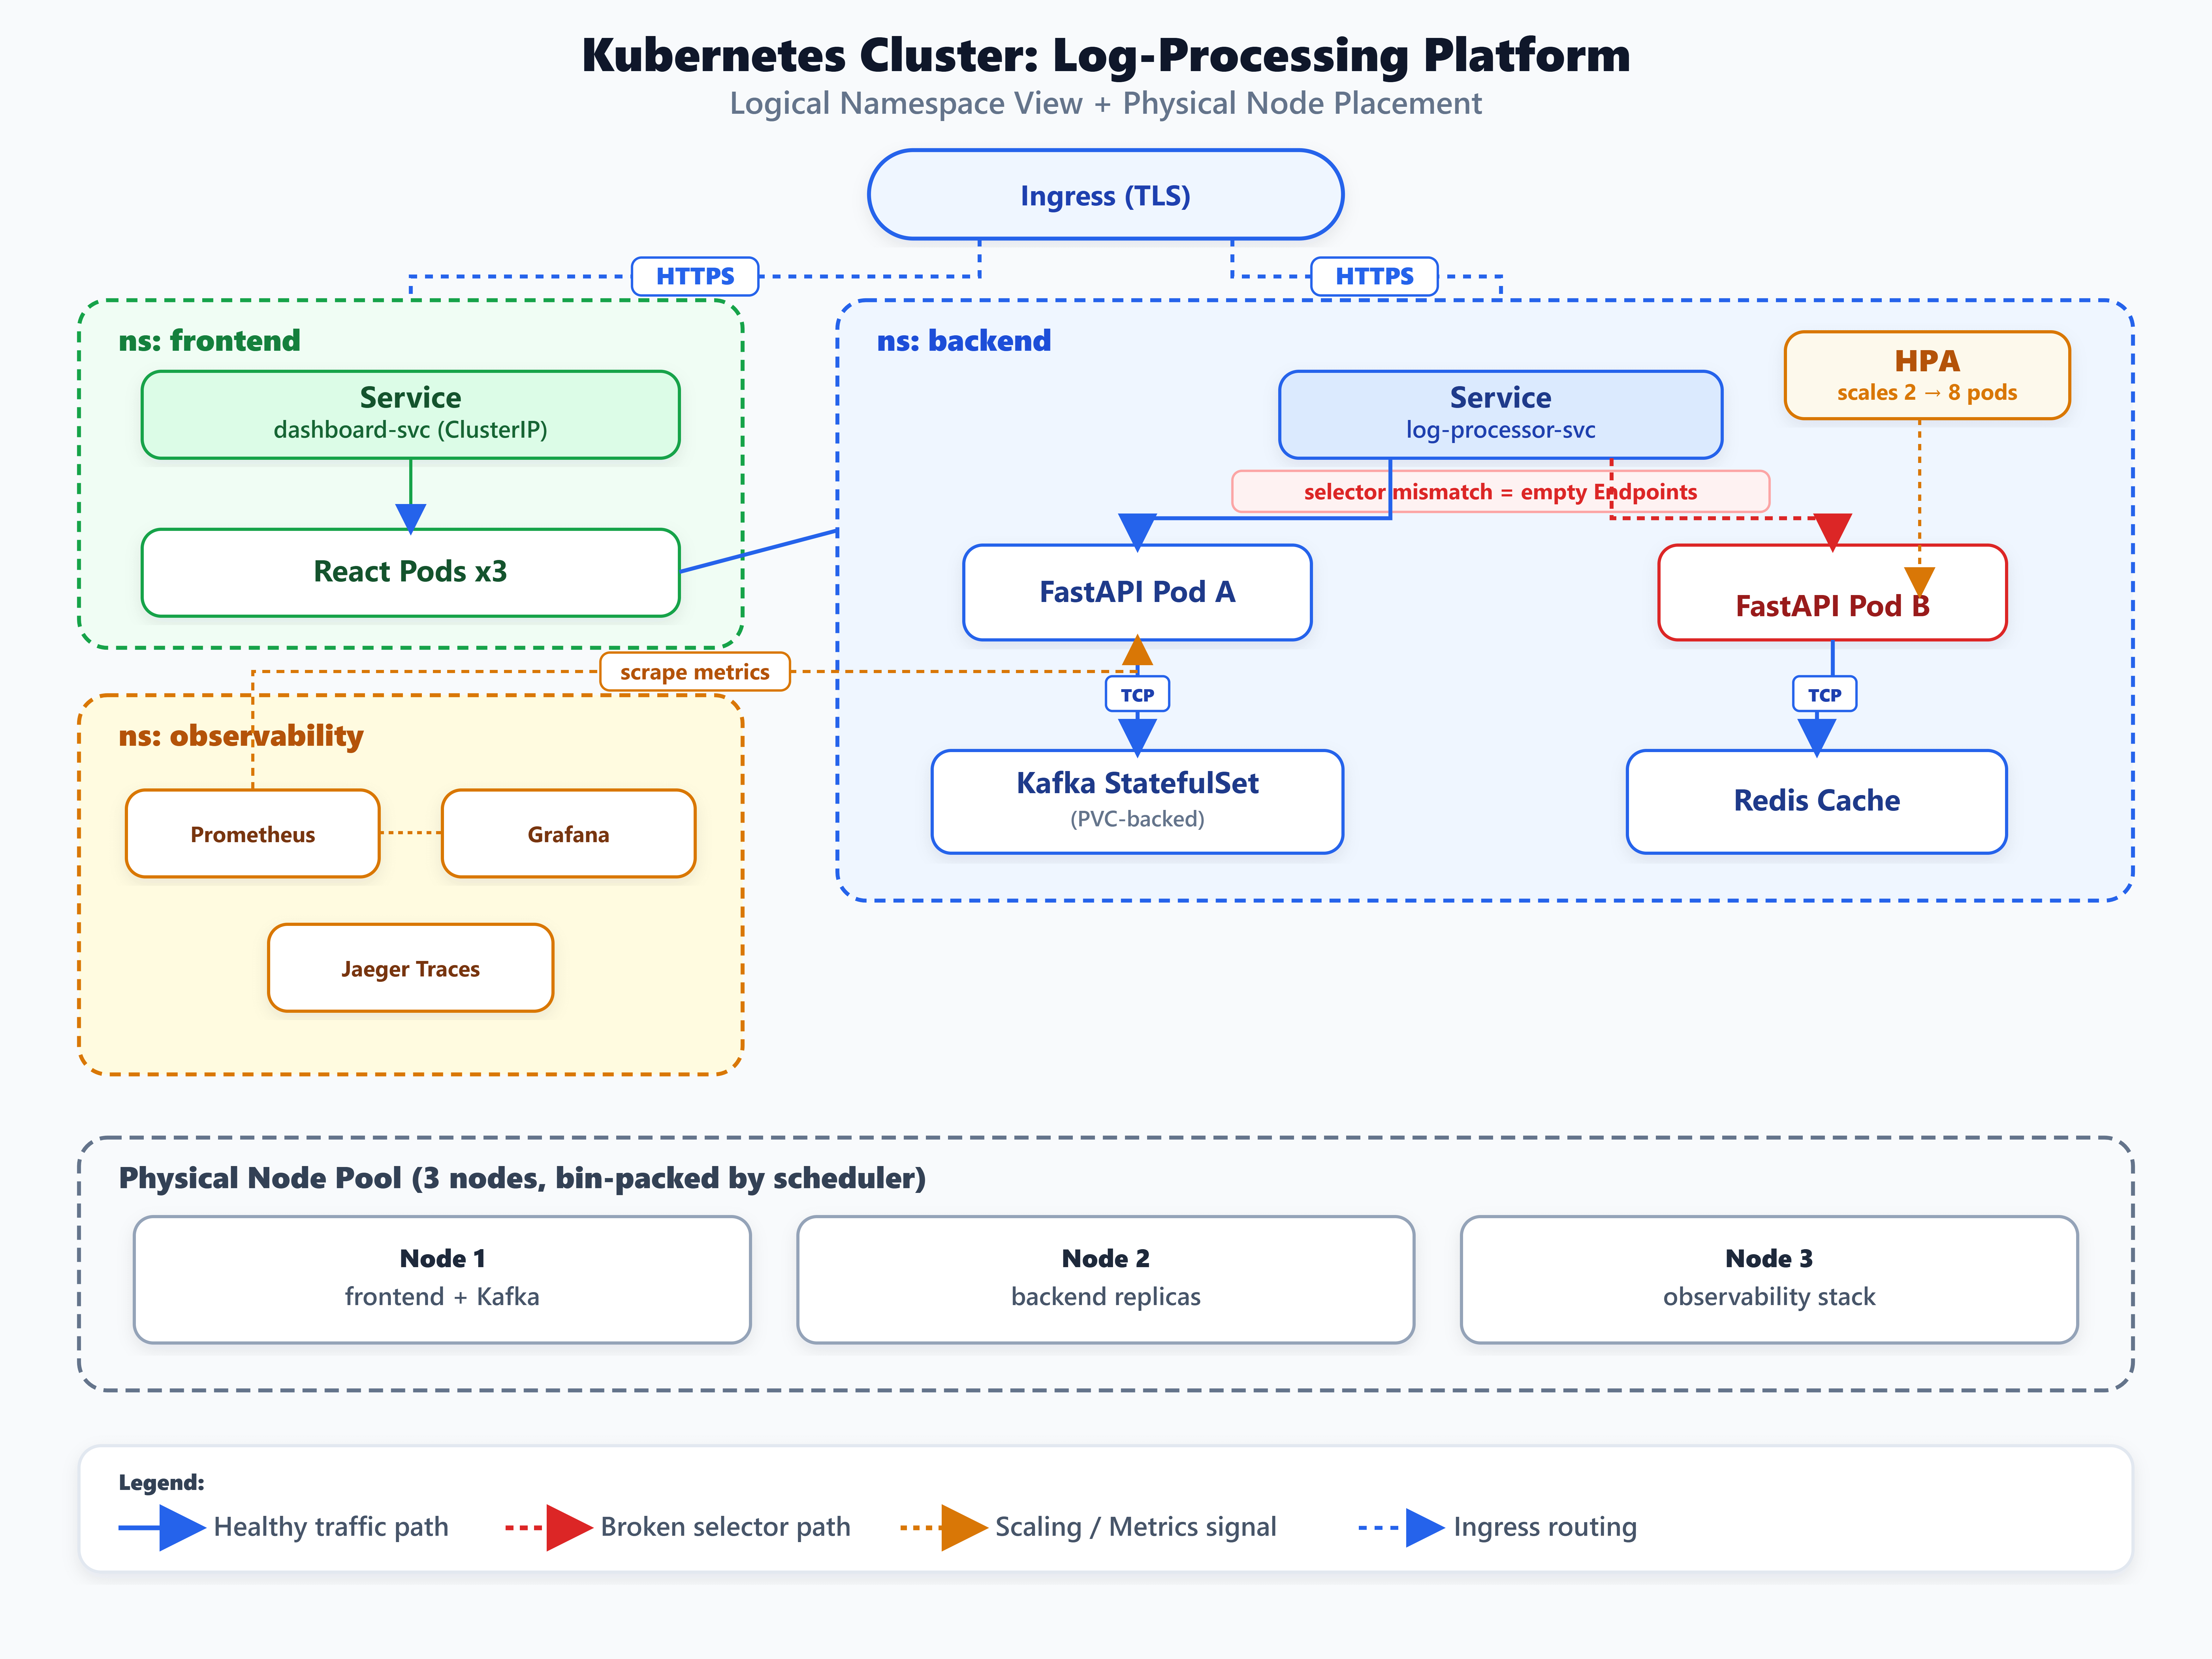
1. Services are label queries, not pipes. A Service has no direct knowledge of Pods — it continuously re-evaluates its spec.selector against the cluster’s Pod label index and materializes matches into an EndpointSlice. This is elegant because it decouples identity from IP, but the failure mode is equally elegant in its ability to hide: a single typo’d label (app: log-processor vs app: log_processor) produces a Service that looks perfectly healthy while silently addressing zero Pods.
2. Readiness gates the Endpoint, not just the container. Even a correct selector produces empty Endpoints if every matching Pod is failing its readiness probe. This is intentional — Kubernetes will never route traffic to a Pod it doesn’t believe can serve it — but it means “Endpoints empty” has at least two independent root causes that require different diagnostics: selector mismatch versus readiness failure. Conflating them wastes incident-response minutes you don’t have.
3. kube-proxy (or the CNI’s eBPF equivalent) is a derived cache, not a source of truth. Even when EndpointSlices are correct, kube-proxy’s iptables/IPVS rules or Cilium’s eBPF maps are asynchronously reconciled. At high Pod churn rates — common during HPA scale-events — there is a real propagation window where Endpoints exist in the API but traffic still fails at the data-plane layer. Netflix and Airbnb-scale platforms mitigate this by favoring eBPF-based CNIs (Cilium) specifically because reconciliation latency drops from seconds to sub-second, which matters when you’re scaling hundreds of Pods per minute.
4. NetworkPolicies fail closed and look identical to selector bugs. A default-deny NetworkPolicy that forgot to allow-list the frontend namespace produces symptoms indistinguishable from a broken selector at first glance: connection refused/timeout, healthy Pods, no obvious error. The differentiator is Endpoints — if Endpoints are populated but traffic still fails, you’ve moved from a scheduling/selector problem to a policy/CNI problem, and your entire diagnostic tree branches differently.
5. DNS is often blamed, rarely guilty. CoreDNS resolves the Service name to a ClusterIP correctly in the overwhelming majority of incidents; the ClusterIP then load-balances across an empty Endpoint set. Engineers who start debugging at DNS waste time. Start at kubectl get endpoints — it is the fastest single command that tells you which half of the stack you’re in.
Anti-pattern: debugging Service outages by restarting Pods first. Restarts change nothing if the selector is wrong, and they destroy the exact Pod state (labels, readiness condition) you need to inspect. Always run kubectl get endpoints <svc> and kubectl get pods --show-labels before touching anything.
Implementation Walkthrough
GitHub Link:
https://github.com/sysdr/k8-course-p/tree/main/lesson70/k8s-log-platform
Deploy the baseline stack with
./deploy.sh, which applies the log-ingestion Deployment, its Service, Redis, Kafka, and the React dashboard behind an Ingress.Trigger the break with
./chaos/break-selector.sh, which patches the Service’s selector toapp: log-processor-v2while Pods remain labeledapp: log-processor. This is intentionally the most common real-world variant: a partial rollout label change.Observe the symptom — the Grafana “Ingestion Success Rate” panel drops to zero within one scrape interval, and Jaeger shows client-side timeouts with no corresponding server-side spans, which is itself a diagnostic signal (spans never started server-side means traffic never arrived).
Diagnose systematically:
kubectl get endpoints log-processor-svc -o yamlreturns an emptysubsetsfield — confirmation the Service/Pod link is broken, not a readiness or policy issue.Compare selectors directly:
kubectl get svc log-processor-svc -o jsonpath='{.spec.selector}'againstkubectl get pods -l app=log-processor -o name. The mismatch is now explicit rather than inferred.Fix and verify: patch the selector back, then confirm
subsetspopulates and Grafana recovers, closing the loop with observable evidence rather than assumption.
What it is
A local log platform demo with:
Backend (FastAPI) — ingests logs, exposes Prometheus metrics
Frontend (React dashboard) — shows live
ingest_total/ errorsRedis — stores counters
Docker Compose — runs everything locally
Prerequisites
Docker + Docker Compose
Bash
1) Generate project
cd /home/systemdr/git/k8-course-p/lesson70
cd k8s-log-platform
2) Run tests
./scripts/test-all.sh3) Start local stack
./scripts/start-local.sh
Open Dashboard:
http://localhost:3000
Metrics: http://localhost:8000/metrics
4) Generate demo traffic
/scripts/demo-generate-traffic.sh http://localhost:8000 15

For a fresh counter (reset backend, then send 15):

./scripts/demo-generate-traffic.sh http://localhost:8000 15 --fresh
5) Stop stack
./scripts/stop.sh6) Cleanup temp/cache
./scripts/cleanup.shStops stack and removes node_modules, venv/.venv, Python caches, frontend build artifacts.
Production Considerations
In production, this failure mode compounds with autoscaling: an HPA scale-up event during a broken-selector window creates Pods that never receive traffic, silently wasting capacity while the incident continues. PodDisruptionBudgets don’t protect against this class of failure at all — they guard voluntary evictions, not selector correctness — which is a common misconception worth correcting explicitly. The durable fix is preventive: a CI gate that diffs Service selectors against Deployment template labels on every merge, plus a Prometheus alert on kube_endpoint_address_available == 0 for any Service with kube_deployment_status_replicas_available > 0, catching the exact contradiction this lesson teaches you to read by hand.
Scale Connection
At FAANG-level scale, this exact class of bug is why companies like Spotify invest in admission-controller-based validation (label-selector linting at deploy time) and why Airbnb’s platform team ships internal CLI tooling that renders the Service→Endpoint→Pod graph as a single diffable object. The lesson generalizes: the more automated your rollout pipeline, the more a single label typo can silently disable traffic to a fleet, which is precisely why senior engineers treat selector/label consistency as a first-class CI concern, not a runtime debugging exercise.