
Lesson 52 : Resource Efficiency: Identifying and Eliminating Kubernetes Waste at Scale
What We’re Building Today
By the end of this lesson, you will have:
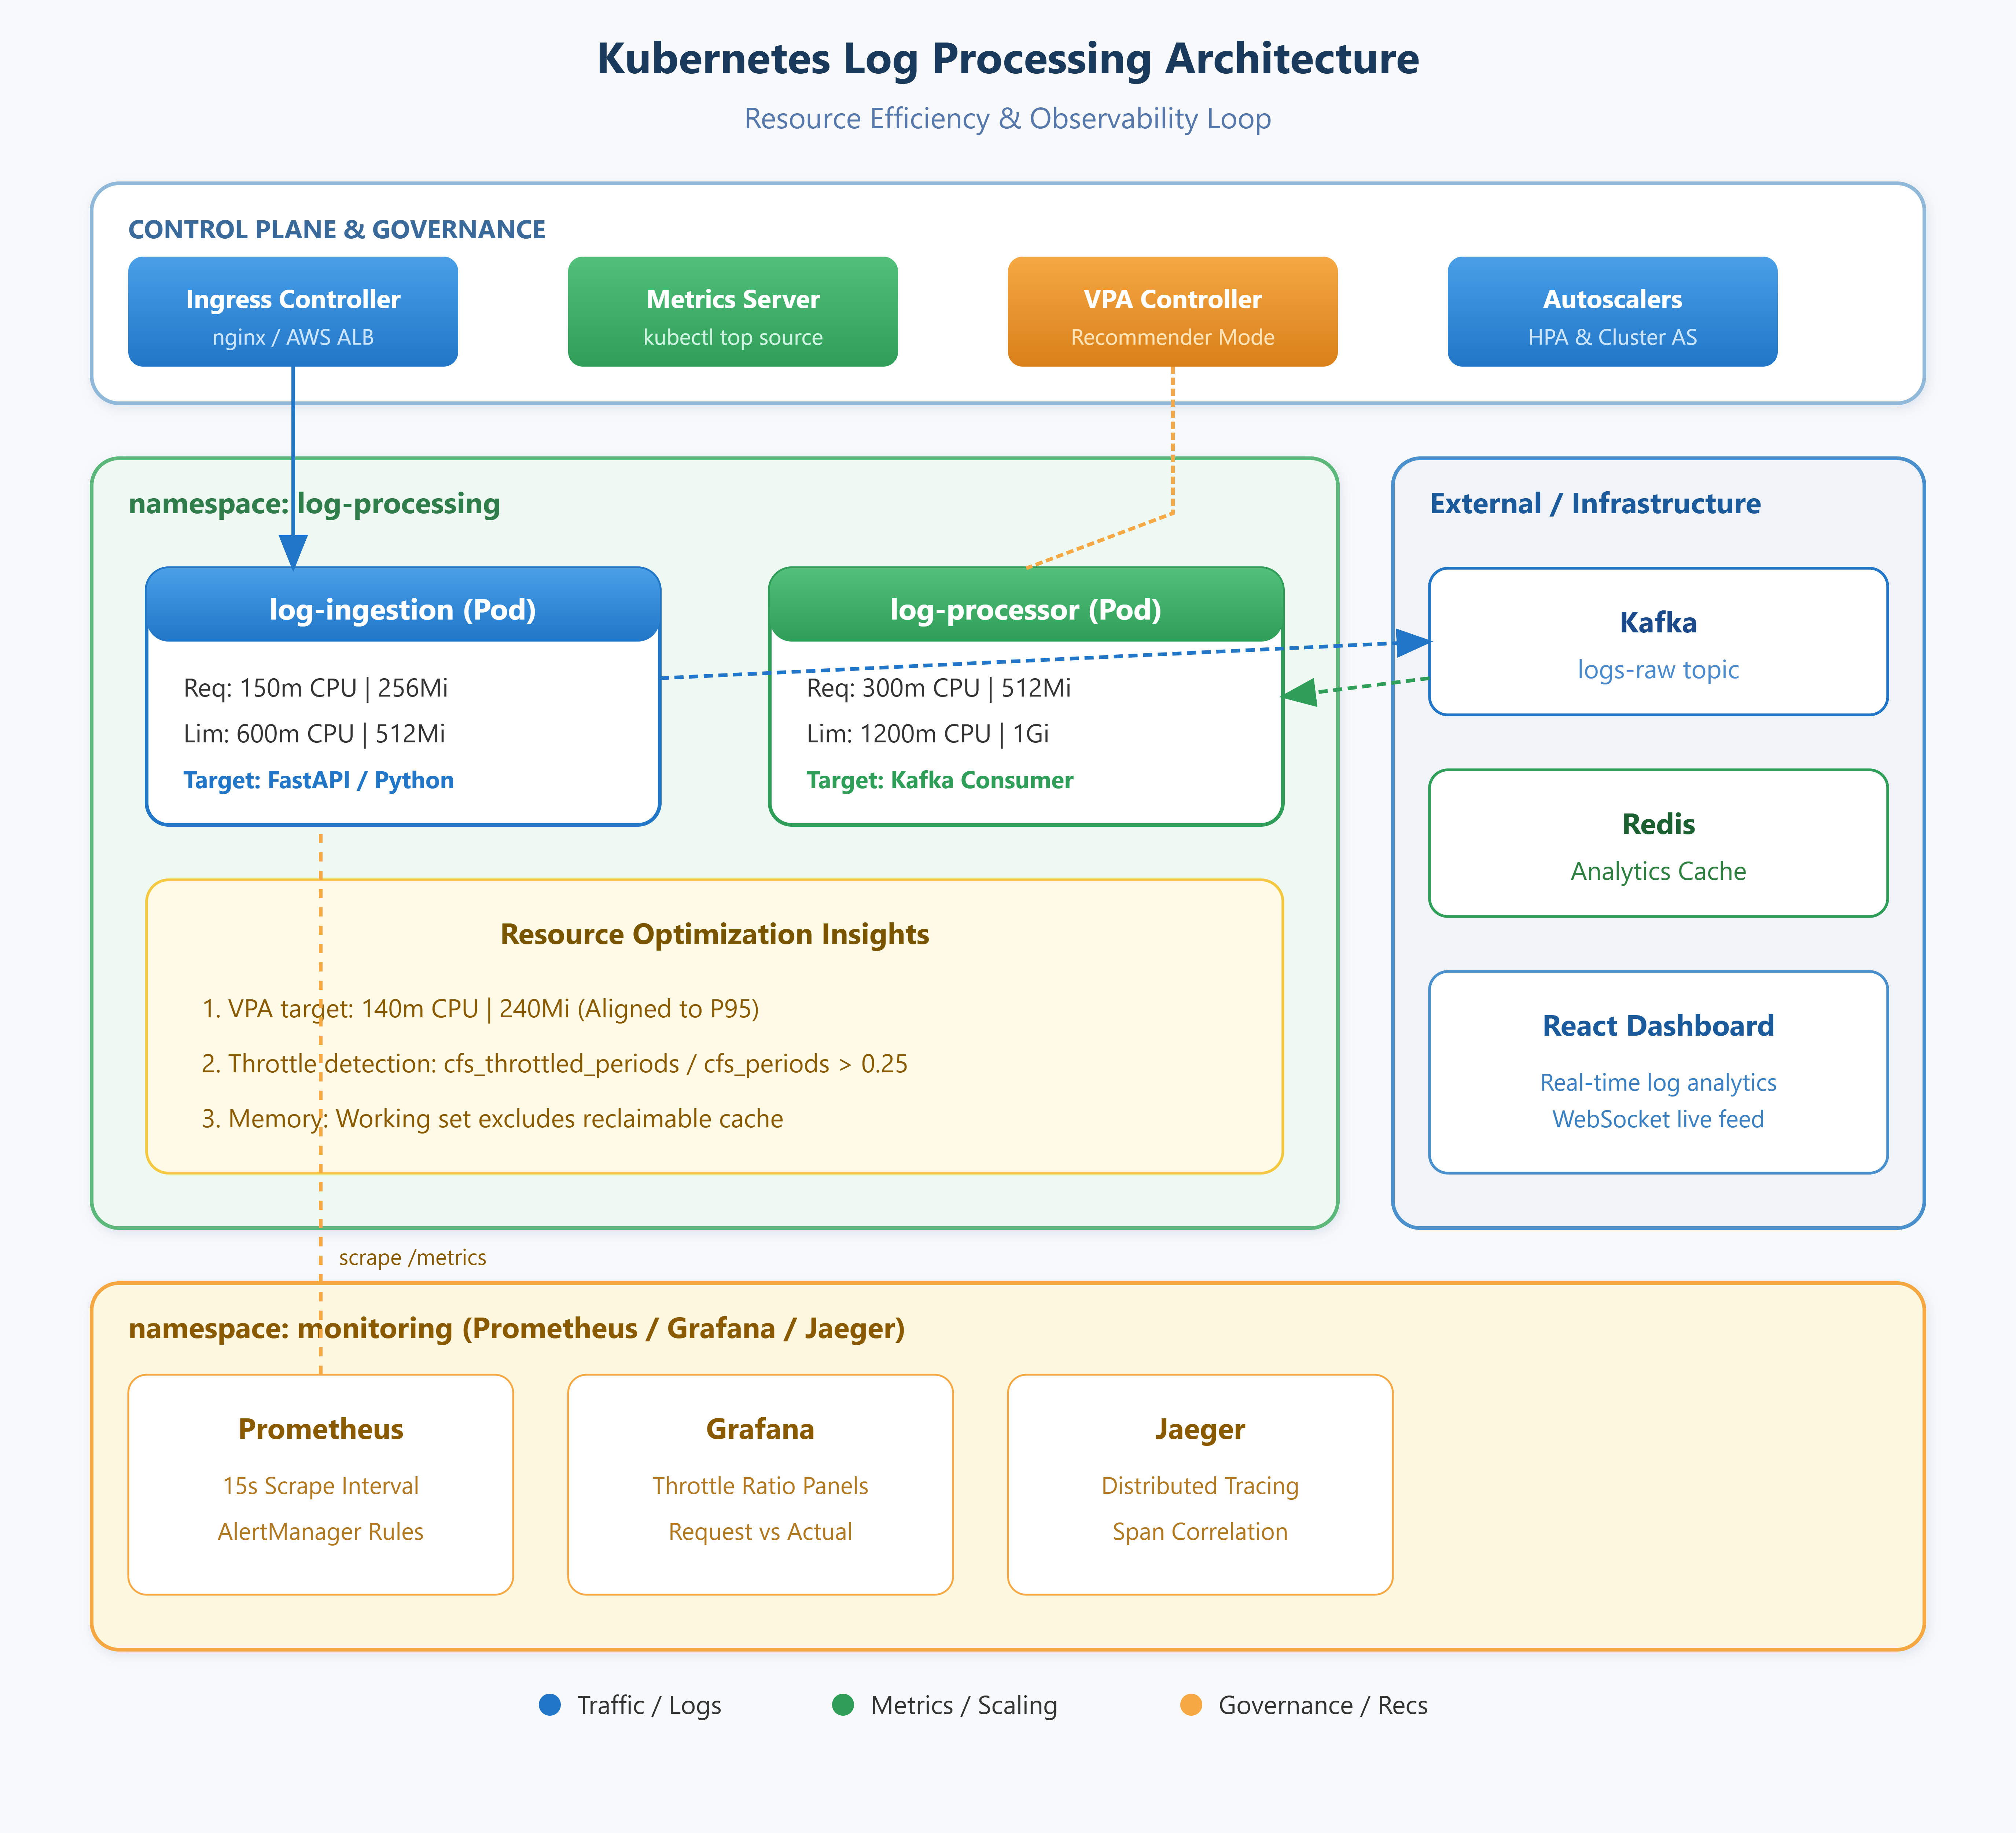
A production-grade log processing platform — three Python microservices (ingestion, processor, analytics) with a React dashboard, all instrumented and containerized
A resource efficiency pipeline —
kubectl top-driven profiling wired into a VPA feedback loop, with Prometheus recording rules capturing the actual baseline before you tuneRightsizing manifests — Kubernetes Deployments with request/limit configurations derived from real profiling data, not intuition, backed by LimitRanges and ResourceQuotas enforcing namespace-level governance
An operational runbook — scripts to simulate load spikes, identify throttling events in cgroup metrics, and produce before/after resource utilization reports
Why This Matters
Resource inefficiency is one of the most expensive and operationally silent failure modes in cloud-native infrastructure. Clusters routinely run at 15–30% actual CPU utilization while nodes sit at 70% requested capacity — a phantom overcommit that blocks the scheduler from placing workloads and drives unnecessary node expansion. Netflix’s container infrastructure team has documented cases where 40% of their EC2 spend on Kubernetes was attributable to stale resource requests copied from staging to production without profiling. Spotify’s SRE organization built an internal “waste dashboard” specifically because their Helm chart defaults — 500m CPU, 512Mi memory — bore no relationship to what their actual Go services consumed.
The core dysfunction: engineers set resource requests at the time of initial deployment, often mirroring whatever a colleague used, and those numbers never get revisited. Meanwhile the scheduler treats requests as hard allocation signals. Pods that request 1 CPU but use 50m aren’t helping your cluster; they’re fragmenting your node capacity and increasing your cloud bill while the HPA under-scales because CPU utilization against requests looks artificially low.
kubectl topis the starting point, not the answer. What you’re actually building here is a profiling discipline — a closed loop from observation to manifest to deployment.
Kubernetes Architecture Deep Dive
Preparing for a distributed systems interview?
→Download the free Interview Pack
→ Subscribe now to access source code repository - 200 + coding lessons
