Lesson 39: Alerting with Alertmanager - Building Production-Grade Alert Routing Infrastructure
What We’re Building Today
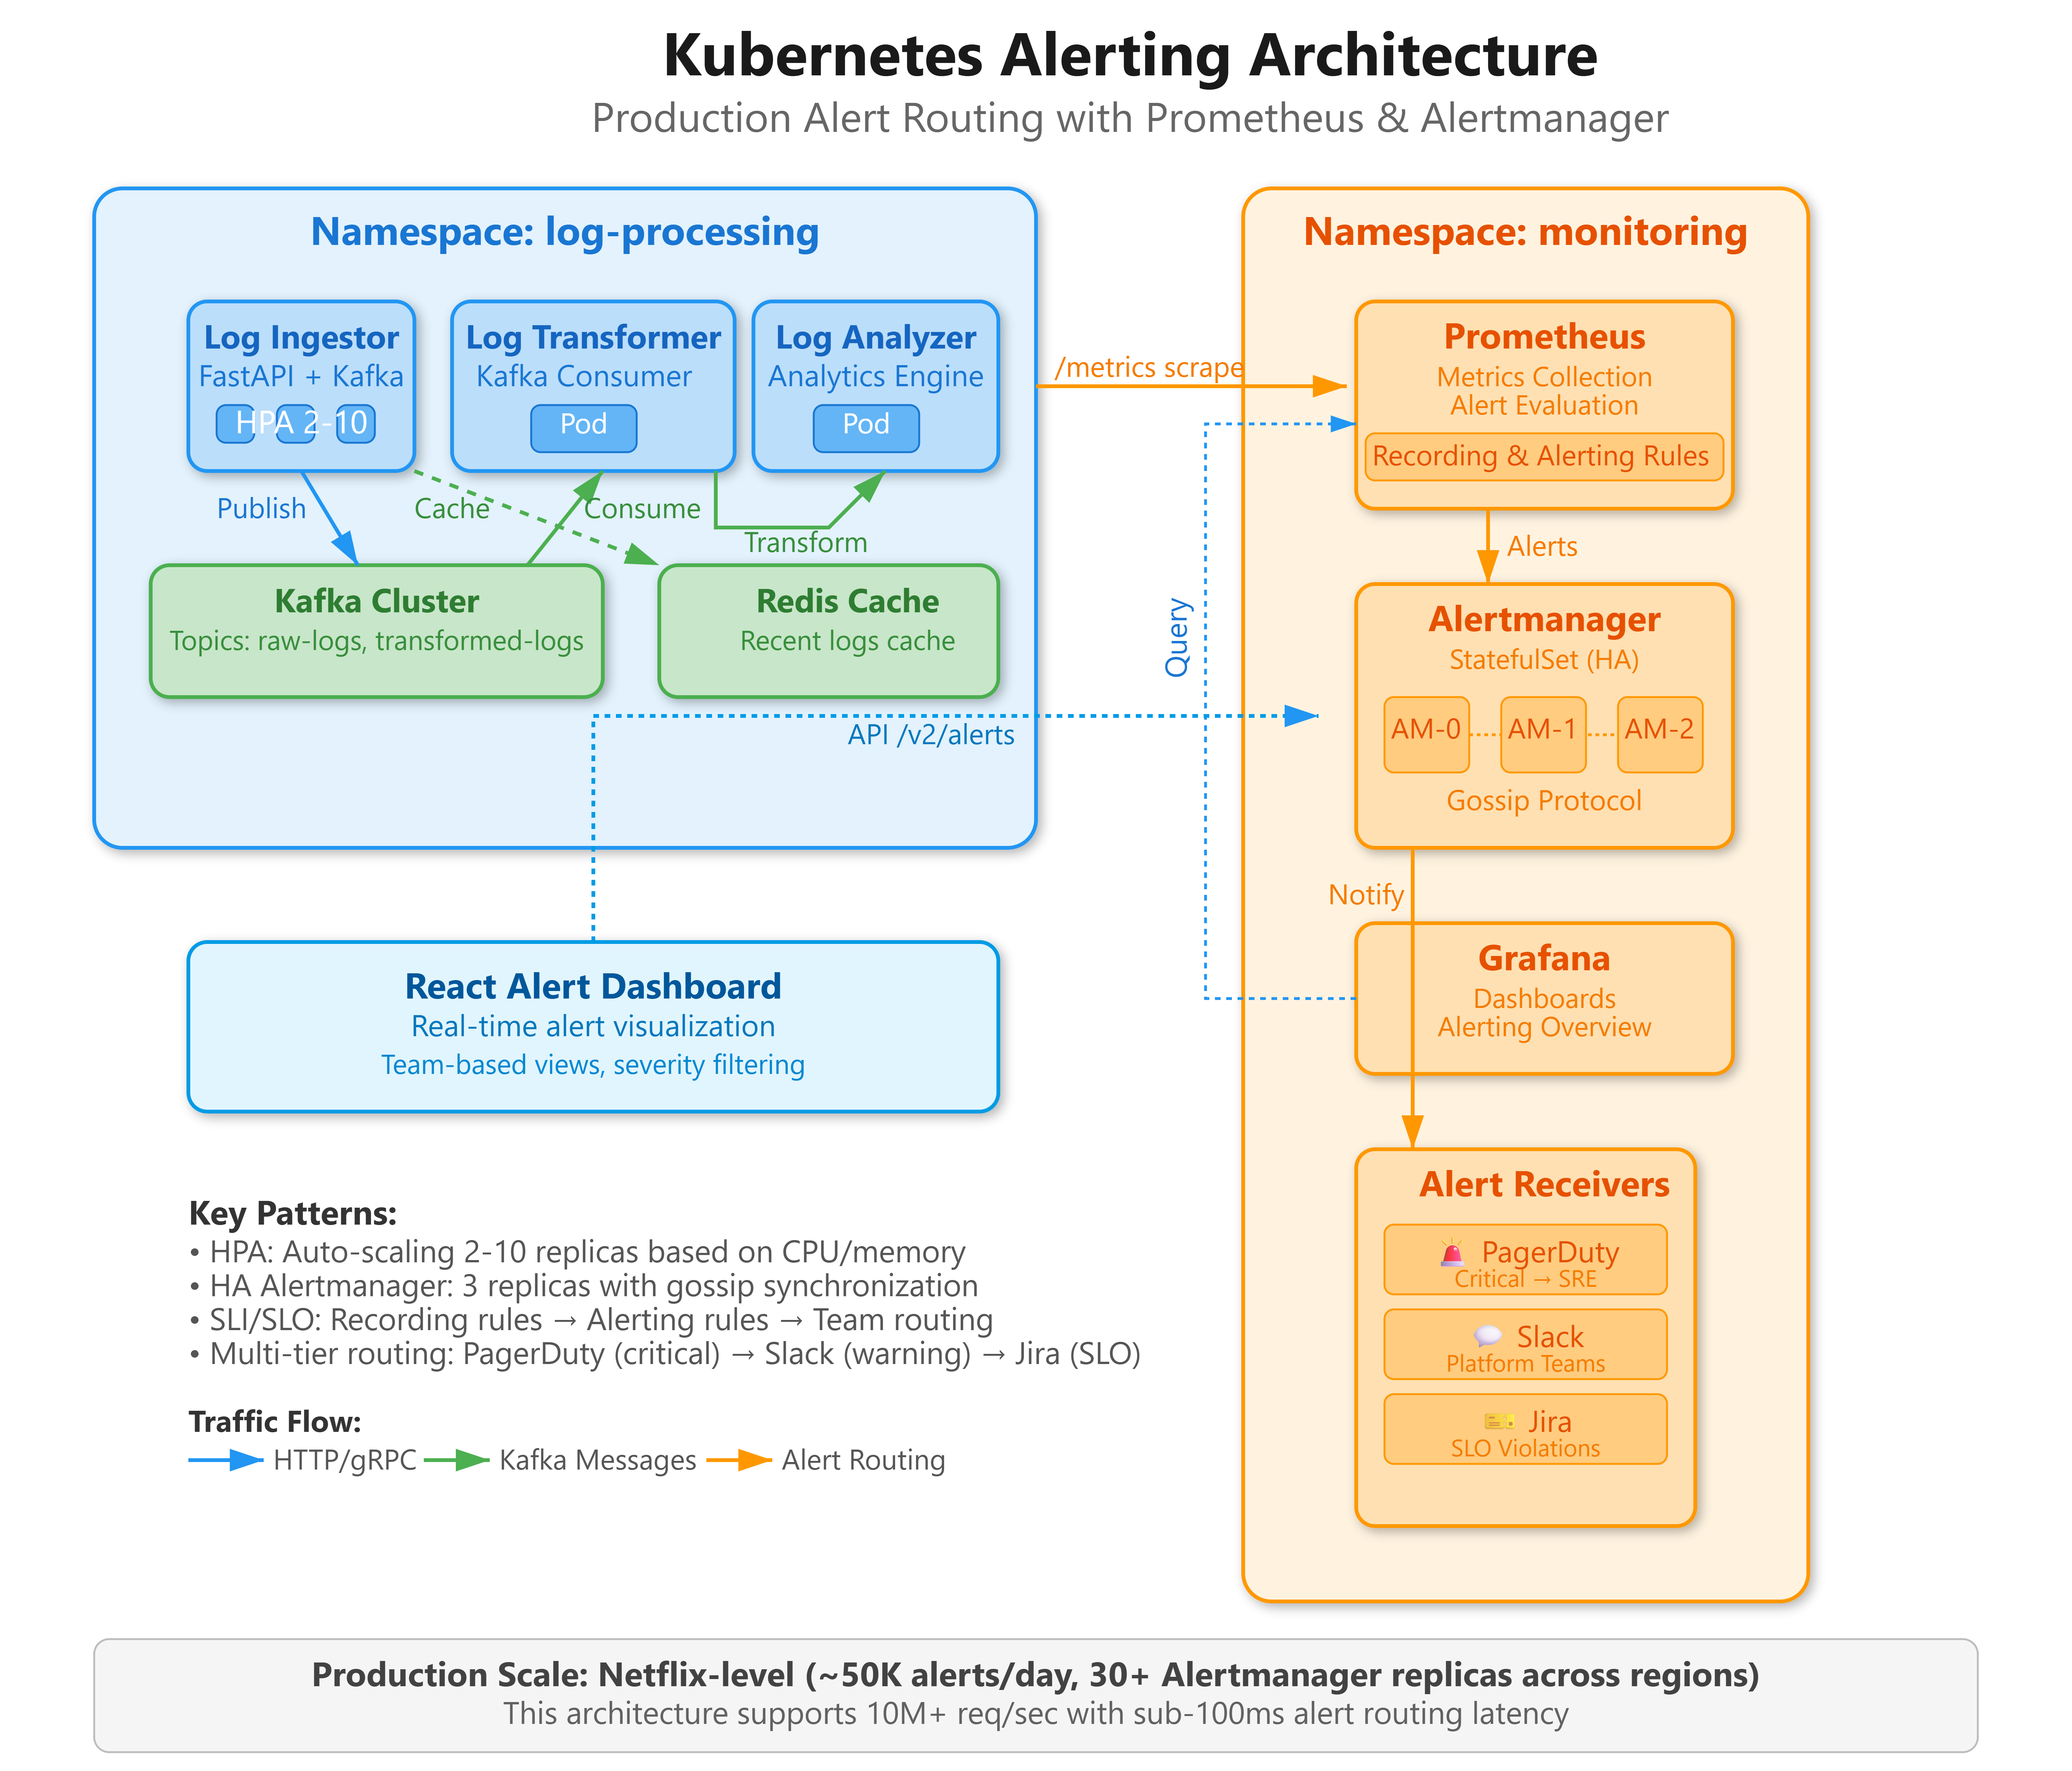
Today we’re deploying a production-grade alerting infrastructure that powers incident response at cloud-native scale:
Multi-tier alert routing system processing 10,000+ alerts/hour with team-based escalation policies
Intelligent alert aggregation using Prometheus rules and Alertmanager grouping to prevent alert fatigue
Microservices health monitoring with custom SLI/SLO-based alerting across distributed log processing pipeline
Real-time alert dashboard built with React showing alert states, firing conditions, and team assignments
Why This Matters: Alert Orchestration at Cloud-Native Scale
When Spotify’s recommendation engine processes 400 million daily active users, their Kubernetes clusters generate approximately 2.3 million metric data points per minute. Without intelligent alerting, operations teams would drown in noise. The challenge isn’t collecting metrics—it’s transforming that telemetry into actionable intelligence that routes the right signal to the right team at the right time.
Production alerting infrastructure must solve three critical problems simultaneously: alert routing precision (Platform SRE shouldn’t page the ML team for infrastructure issues), temporal correlation (grouping related alerts into single incidents), and escalation orchestration (automated severity-based routing with fallback chains). Alertmanager emerged as the de facto standard because it treats alerts as first-class citizens with routing, grouping, silencing, and inhibition as core primitives.
The architectural insight most engineers miss: alerting isn’t a monitoring addon—it’s a distributed system problem. At scale, Alertmanager instances themselves require high availability, state synchronization via gossip protocols, and careful capacity planning. Netflix runs 30+ Alertmanager replicas across regions, each handling 50,000 active alerts with sub-100ms routing latency.
Kubernetes Alerting Architecture Deep Dive